Debugging
Finding and fixing bugs is an important part of the hardware and software development process. Sometimes you also need to use debugging techniques to understand how the system works. Two tools that are helpful are debug logging and debugging using the GNU Debugger (gdb).
Debug Logging
NuttX has a powerful system logging facility (syslog) with info, warn, and error levels. You can enable
debugging for your build for the subsystem or feature by using the menuconfig system.
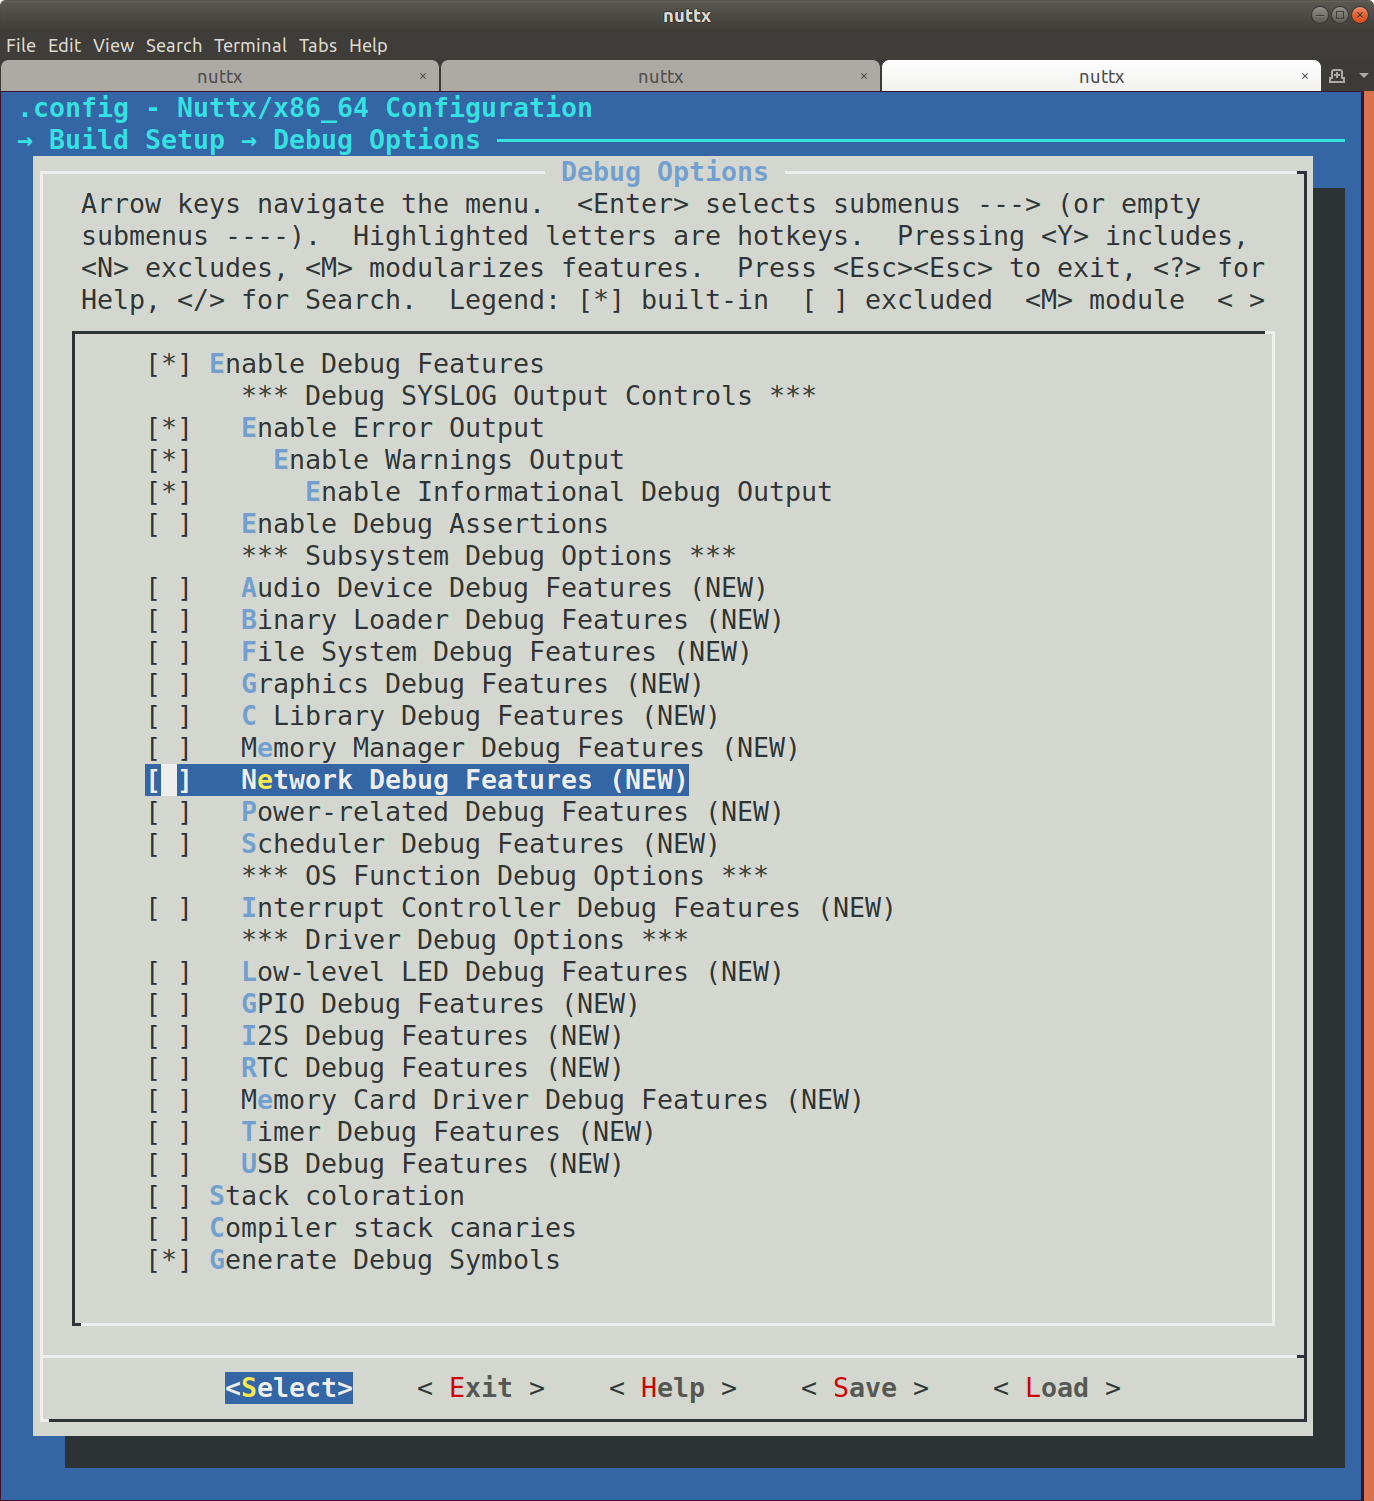
The debug options are available under . You will most likely have to enable the following options:
— selecting this will turn on subsystem-level debugging options, they will become visible on the page below. You can then select the ones you want.
— this will only log errors.
— this will log warnings and errors.
— this will produce informational output, warnings, and errors.
You can then select from the subsystems that are available, Network, Scheduler, USB, etc. Note that you will need to
separately enable the subsystem elsewhere in the menuconfig system. To see the CONFIG define that is set,
use the arrow keys to highlight the subsystem (for instance, ) and type ?. This will show
you that the C macro that is set is called CONFIG_DEBUG_NET. nuttx/debug.h defines the netinfo() logging
function that will log output if this macro is set. You can search the source code for netinfo to see how it is
used.
Note that enabling all these will produce an incredible amount of logging output. Enable the level you want and the area you’re interested in, and leave the rest disabled, save the config, and then recompile. You can see the full list of debug feature logging functions in the file debug.h.
Syslog timestamps can be enabled in the configuration in (CONFIG_SYSLOG_TIMESTAMP).
You may need to do a little bit of experimenting to find the combination of logging settings that work for the problem you’re trying to solve. See the file debug.h for available debug settings that are available.
There are also subsystems that enable USB trace debugging, and you can log to memory too, if you need the logging to be faster than what the console can output.
Debugging with openocd and gdb
To debug our Nucleo board using its embedded SWD debug adapter,
start openocd with the following command:
$ openocd -f interface/stlink-v2.cfg -f target/stm32f1x.cfg
This will start a gdb server. Then, start gdb with:
$ cd nuttx/
$ gdb-multiarch nuttx/nuttx
Inside gdb console, connect to the gdb server with:
(gdb) target extended-remote :3333
You can now use standard gdb commands. For example, to
reset the board:
(gdb) mon reset
To halt the board:
(gdb) mon halt
To set a breakpoint:
(gdb) breakpoint nsh_main
and to finally start nuttx:
(gdb) continue
Continuing.
Breakpoint 1, nsh_main (argc=1, argv=0x200ddfac) at nsh_main.c:208
208 sched_getparam(0, ¶m);
(gdb) continue
Continuing.
Tip
You can abbreviate gdb commands: info b is a shortcut for
information breakpoints; c works the same as continue, etc.
NuttX aware debugging
Since NuttX is actually an RTOS, it is useful to have gdb be aware of the different
tasks/threads that are running. There are two ways to do this: via openocd
itself or via gdb. Note that in both cases, you need to enable debug symbols
(CONFIG_DEBUG_SYMBOLS).
With openocd
openocd supports various RTOS directly, including NuttX. It works by reading
into internal NuttX symbols which define the active tasks and their properties.
As a result, the gdb server will directly be aware of each task as a different
thread. The downside of this approach is that it depends on how you build NuttX
as there are some options hardcoded into
opencd. By default, it assumes:
CONFIG_DISABLE_MQUEUE=y
CONFIG_LEGACY_PAGING=n
If you need these options to be set differently, you will have to edit ./src/rtos/nuttx_header.h from openocd,
change the corresponding settings and then rebuild it.
Finally, to enable NuttX integration, you need to supply an additional openocd argument:
$ openocd -f interface/stlink-v2.cfg -f target/stm32f1x.cfg -c '$_TARGETNAME configure -rtos nuttx'
Since openocd also needs to know the memory layout of certain datastructures, you need to have gdb
run the following commands once the nuttx binary is loaded:
eval "monitor nuttx.pid_offset %d", &((struct tcb_s *)(0))->pid
eval "monitor nuttx.xcpreg_offset %d", &((struct tcb_s *)(0))->xcp.regs
eval "monitor nuttx.state_offset %d", &((struct tcb_s *)(0))->task_state
eval "monitor nuttx.name_offset %d", &((struct tcb_s *)(0))->name
eval "monitor nuttx.name_size %d", sizeof(((struct tcb_s *)(0))->name)
One way to do this is to define a gdb hook function that will be called when running file command:
define hookpost-file
  eval "monitor nuttx.pid_offset %d", &((struct tcb_s *)(0))->pid
  eval "monitor nuttx.xcpreg_offset %d", &((struct tcb_s *)(0))->xcp.regs
  eval "monitor nuttx.state_offset %d", &((struct tcb_s *)(0))->task_state
  eval "monitor nuttx.name_offset %d", &((struct tcb_s *)(0))->name
  eval "monitor nuttx.name_size %d", sizeof(((struct tcb_s *)(0))->name)
end
You will see that openocd has received the memory offsets in its output:
Open On-Chip Debugger 0.10.0+dev-01514-ga8edbd020-dirty (2020-11-20-14:23)
Licensed under GNU GPL v2
For bug reports, read
        http://openocd.org/doc/doxygen/bugs.html
Info : auto-selecting first available session transport "swd". To override use 'transport select <transport>'.
Info : target type name = cortex_m
Info : Listening on port 6666 for tcl connections
Info : Listening on port 4444 for telnet connections
15:41:23: Debugging starts
Info : CMSIS-DAP: SWD  Supported
Info : CMSIS-DAP: FW Version = 1.10
Info : CMSIS-DAP: Interface Initialised (SWD)
Info : SWCLK/TCK = 1 SWDIO/TMS = 1 TDI = 0 TDO = 0 nTRST = 0 nRESET = 1
Info : CMSIS-DAP: Interface ready
Info : clock speed 1000 kHz
Info : SWD DPIDR 0x2ba01477
Info : nrf52.cpu: hardware has 6 breakpoints, 4 watchpoints
Info : starting gdb server for nrf52.cpu on 3333
Info : Listening on port 3333 for gdb connections
Info : accepting 'gdb' connection on tcp/3333
Error: No symbols for NuttX
Info : nRF52832-QFAA(build code: B0) 512kB Flash, 64kB RAM
undefined debug reason 8 - target needs reset
Warn : Prefer GDB command "target extended-remote 3333" instead of "target remote 3333"
Info : pid_offset: 12
Info : xcpreg_offset: 132
Info : state_offset: 26
Info : name_offset: 208
Info : name_size: 32
target halted due to debug-request, current mode: Thread
xPSR: 0x01000000 pc: 0x000000dc msp: 0x20000cf0
target halted due to debug-request, current mode: Thread xPSR: 0x01000000 pc: 0x000000dc msp: 0x20000cf0
Note
You will probably see the Error: No symbols for NuttX error appear once at startup. This is OK
unless you see it every time you step the debugger. In this case, it would mean you did not enable debug symbols.
Now, You can now inspect threads:
(gdb) info threads
  Id   Target Id         Frame
* 1    Remote target     nx_start_application () at init/nx_bringup.c:261
(gdb) info registers
r0             0x0                 0
r1             0x2f                47
r2             0x0                 0
r3             0x0                 0
r4             0x0                 0
r5             0x0                 0
r6             0x0                 0
r7             0x20000ca0          536874144
r8             0x0                 0
r9             0x0                 0
r10            0x0                 0
r11            0x0                 0
r12            0x9                 9
sp             0x20000c98          0x20000c98
lr             0x19c5              6597
pc             0x1996              0x1996 <nx_start_application+10>
xPSR           0x41000000          1090519040
fpscr          0x0                 0
msp            0x20000c98          0x20000c98
psp            0x0                 0x0 <_vectors>
primask        0x0                 0
basepri        0xe0                -32
faultmask      0x0                 0
control        0x0                 0
With GDB
You can also do NuttX aware debugging using gdb scripting support.
The benefit is that it works also for the sim build where openocd is
not applicable. For this to work, you will need to enable PROC filesystem support
which will expose required task information (CONFIG_FS_PROCFS=y).
To use this approach, you can load the nuttx/tools/pynuttx/gdbinit.py file. An
easy way to do this is to add an extra command:
$ gdb nuttx -ix=tools/pynuttx/gdbinit.py
gdb can need to set the current elf support architecture, for example, the prefix is arm-ebai-none-.
(gdb) info threads
Id   Thread                Info                                                                             Frame
*0   Thread 0x20000398     (Name: Idle Task, State: Running, Priority: 0, Stack: 1000)                      0x80001ac __start() at chip/stm32_start.c:111
1    Thread 0x10000188     (Name: nsh_main, State: Waiting,Semaphore, Priority: 100, Stack: 2000)           0x800aa06 sys_call2() at /home/ajh/work/vela_all/nuttx/include/arch/syscall.h:187
(gdb) (gdb) nxgcore -r 0x40200000,0x48000000,0x07
Saved corefile nuttx.core
Please run gdbserver.py to parse nuttx.core
The python script has extended many commands like thread <id> ,
thread apply <all|id list> cmd, nxsetargs etc.
You can use help <command> to get help.
Note that if you need to continue debugging after using the thread command,
please use c instead of continue, because thread will force the register to be set,
and the c command will restore the register before conitune.